How to Expose and Enable K3s with Traefik Dashboard
Posted March 22, 2024
K3s provides all the juices you need to create a lightweight Kubernetes cluster. Once you install K3s, you get Traefik ready and your Kubernetes cluster Ingress Controller. However, to access K3s with the Traefik dashboard, you have to Enable it manually within your cluster.
In this guide, you will how to enable and expose your K3s Kubernetes clusters with Traefik Dashboard. You will learn:
- How to install k3s and get the Traefik Ingress dashboard.
- Enable K3s Traefik dashboard using Ingress Helm chart.
- Exposing the Traefik dashboard on the web.
- How to expose the Traefik dashboard in a K3s K3D setup.
Step 1: Understanding K3s Traefik Dashboard
Traefik itself is the default K3s Ingress Controller. This way you can use K3s and Traefik to:
- Expose K3s to dashboard
- Manage HTTPS with Let’s Encrypt
- Use K3s and Traefik as the Service Mesh
- Manage cluster Traefik and load balancing
Traefik has many functions. Let’s now dive into the theme of this example tutorial to enable and expose K3s with Traefik Dashboard.
Step 2: Installing K3s with Traefik Dashboard
You first need K3s installed on your computer. Use the following command:
curl -sfL https://get.k3s.io | sh -
If you get stuck, check this How to Install K3s on Ubuntu.
This guide will also show how to set up the K3s Traefik dashboard with k3d. If you are using K3D, ensure you have K3s cluster ready using K3D.
Step 3: How K3s Works with Traefik Dashboard
If your K3s cluster is ready, Traefik should be ready by default. Try running the following command and confirm the following Traefik pods are running:
kubectl get pods -n kube-system
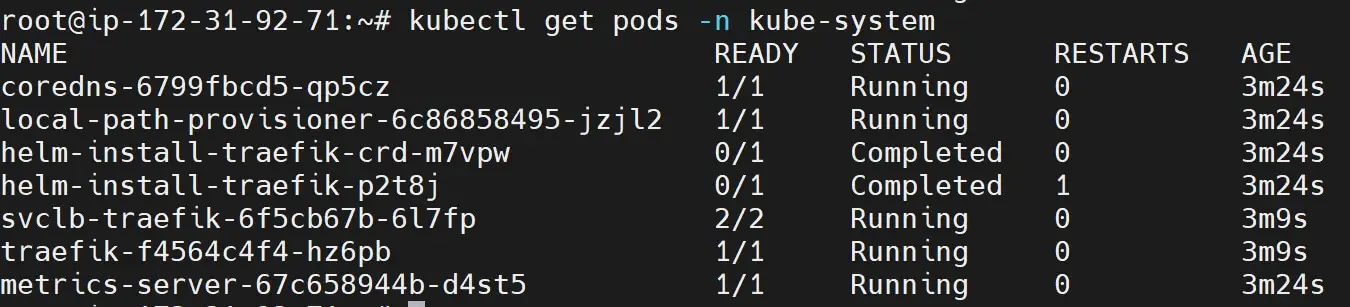
K3s creates a kube-system to manage its default resources such as Traefik. Now, to access the Traefik Dashboard, you will now need to expose a Traefik pod to the browser.
For Traefik to get the K3s Traefik pod, you need to add your extra HelmChartConfig manifests to /var/lib/rancher/k3s/server/manifests. the path /var/lib/rancher/k3s/server/manifests saves the Traefik CRD and HelmChartConfig. You can access this path as follows: ( Use sudo su - to elevate path permissions)
ubuntu@ip-172-31-92-71:~$ sudo su -
root@ip-172-31-92-71:~# cd /var/lib/rancher/k3s/server/manifests
root@ip-172-31-92-71:/var/lib/rancher/k3s/server/manifests# ls
ccm.yaml local-storage.yaml rolebindings.yaml traefik.yaml
coredns.yaml metrics-server runtimes.yaml
root@ip-172-31-92-71:/var/lib/rancher/k3s/server/manifests#
In this case, Traefik will modify the traefik.yaml chart will different values. A good example of such changes is created in this value.yaml file.
You will need to edit this file so K3s can enable and expose the K3s Traefik Dashboard. However, every time K3s restart or your machine, the file will reset. This means DO NOT edit traefik.yaml manually.
Step 4: Enable K3s with Traefik Dashboard
To get it right, K3s will add the additional config to the traefik.yaml. However, you will have to create a traefik-config.yaml in the same path as traefik.yaml
This means you will create a /var/lib/rancher/k3s/server/manifests/traefik-config.yaml file and enable the K3s Traefik dashboard as follows:
apiVersion: helm.cattle.io/v1
kind: HelmChartConfig
metadata:
  name: traefik
  namespace: kube-system
spec:
  valuesContent: |-
    # Settings for Traefik Helm chart
    dashboard:
    # Toggle Traefik dashboard for monitoring
      enabled: true
    ports:
      traefik:
      # Open up Traefik dashboard port 9000
        expose: true
        # Caution: Not recommended for production environments
        # Intended for local traefik dashboards only
    logs:
      access:
      # Turn on access logs for Traefik
        enabled: true
Make sure this new traefik-config.yaml file is created on the path /var/lib/rancher/k3s/server/manifests and add the above content.
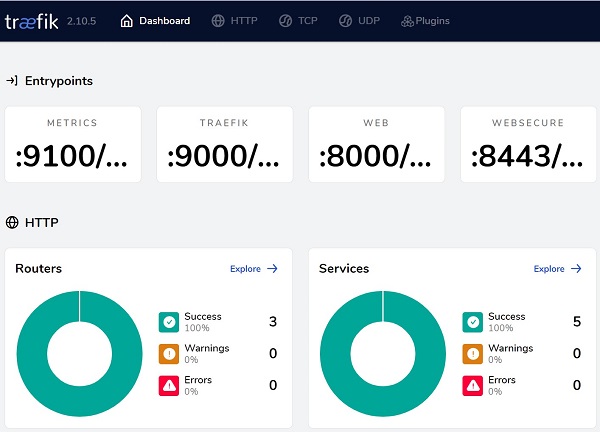
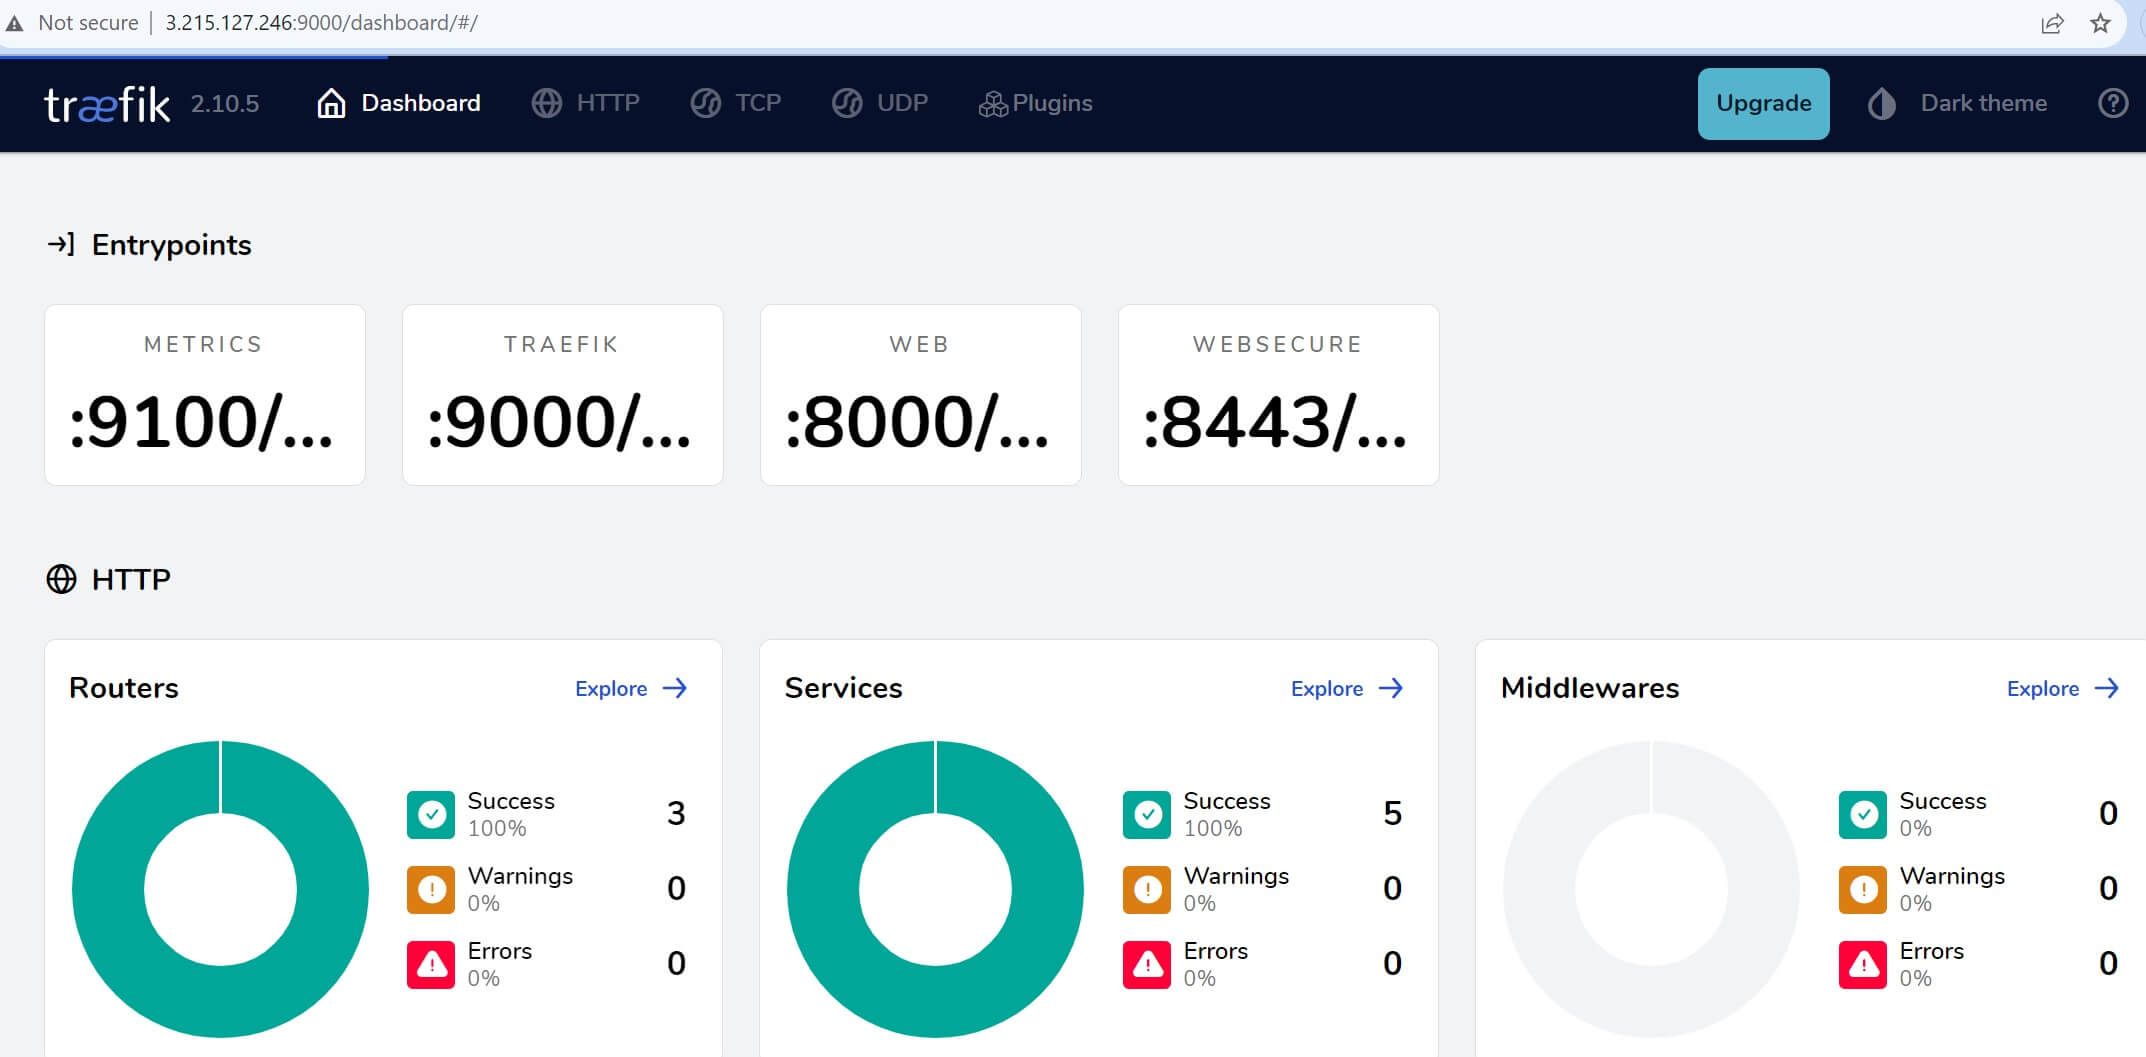
Step 5: Expose K3s with Traefik Dashboard
K3s will expose Traefik on Port 9000. This means it’s the port you will use to get the dashboard. Use localhost or the IP address to access your K3s Traefik dashboard.
If you are on a localhost machine the Traefik dashboard is accessible using:
http://traefik.localhost/dashboardorhttp://localhost:9000/dashboard/
Alert ⚠️: Be Aware of trailing slash. Otherwise, you will get a 404 error.
Conclusion
You have learned:
- How to install k3s and get the Traefik Ingress dashboard.
- Enable K3s Traefik dashboard using Ingress Helm chart.
- Exposing the Traefik dashboard on the web.
I hope you found the guide helpful!
Written By: